A few days ago, I wrote about how I built a system for monitoring the weather using Arduino, and InfluxDB and Grafana.
InfluxDB is a wickedly cool Time Series Database, which makes it super easy to store time-based measurements, such as weather measurements, but also more traditional metrics, like server CPU and disk utilisation.
In the past, I’ve used Munin, an RRDtool based monitoring utility, but it feels kind of clunky these days, and RRDtool can be a bit of a bugger to extract data back out, and there’s a certain degree of lossy compression in the graphs too, which can make particularly spiky events look a lot smoother than perhaps they might be.
Enter Telegraf.
Telegraf is one of the other components produced by Influx, and it’s basically a massively extensible, plugin driven data collecting thingy.
There are many dozens of plugins, batteries included. For example, this is the list of ‘input’ plugins for it, that you get for free when you install it.
It supports squirting data into a wide variety of databases too, not just InfluxDB, but things like ElasticSearch, MQTT, Graylog, amqp (for rabbitMQ), plain old TCP sockets and many others.
In this case, I’m just using it to gather stats from the server’s CPU, memory, disk and so on, and squirt those into InfluxDB, and using the same Grafana instance that hosts the weather dashboard to host a few System Dashboards for the various bits of architecture in my home lab.
If you can’t find a plugin to monitor the thing you want to monitor, you have two options. You can either write a native plugin in Go (if that’s your bag), or use the [[inputs.exec]] builtin which will run a script and take the output from stdout and slurp that data in.
Now, I know this sounds like a sponsored post, but I can guarantee you it’s not. I just like sharing the neat tools I’ve discovered, and the slightly unusual ways I’m using them.
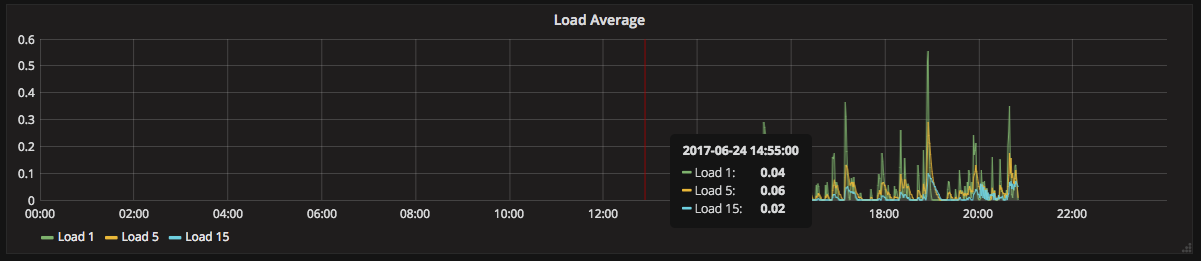
In Grafana, I’ve basically configured a few simple graphs for things like Load Average, Disk Utilisation, Memory Usage and so on, and I’m starting to get a few pretty graphs out of it.
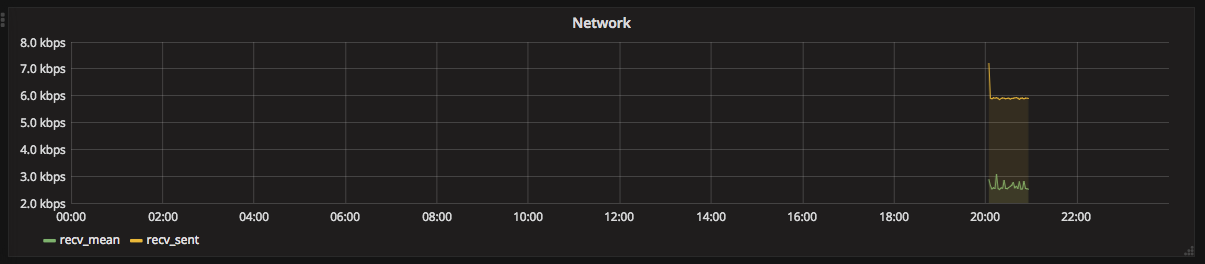
Network throughput requires a subtly different approach, because we’re after a rate, not a counter, so we have to use the builtin DERIVATIVE(value, time) function, as DERIVATIVE(MEAN($measurement), 1s) to get a rate in Bytes/second, then multiply by 8, to get bits/second.
The full query looks like this:
SELECT derivative(mean("bytes_recv"), 1s) *8 FROM "net" WHERE "host" = 'werahost' AND $timeFilter GROUP BY time($__interval) fill(none)